Track your channel analytics
To track your Videas channel analytics, open the Analytics section. A dashboard brings together your key metrics (plays, visitors, watch time, completion) and four tabs — Overview, Content, Users, Audience — which you filter by period and by criteria. You can also look at the analytics for a specific user from their profile. The data is real and privacy-friendly (GDPR-compliant analytics).
This guide walks through the channel dashboard, then the per-user analytics.
Three analytics dashboards in Videas — depending on what you are after:
- Your channel (your site’s audience, registered members): this article.
- Your videos and content (plays, completion, geography, playback sites): Understand your video analytics.
- A share link (who opened and watched one specific link): Analytics for a share link (the “View a link’s analytics” section).
Open your channel analytics
In your channel navigation, open Analytics (“Understand your audience and how your content performs”). At the top:
- a period selector (7 days, 30 days, 90 days, 12 months, or a custom range);
- a Filters button that opens a drawer (“Refine this channel’s analytics”): Audience (Everyone / Registered), Devices, Countries, Content types (Video / Audio / Article). A badge shows how many filters are active; Clear resets them.
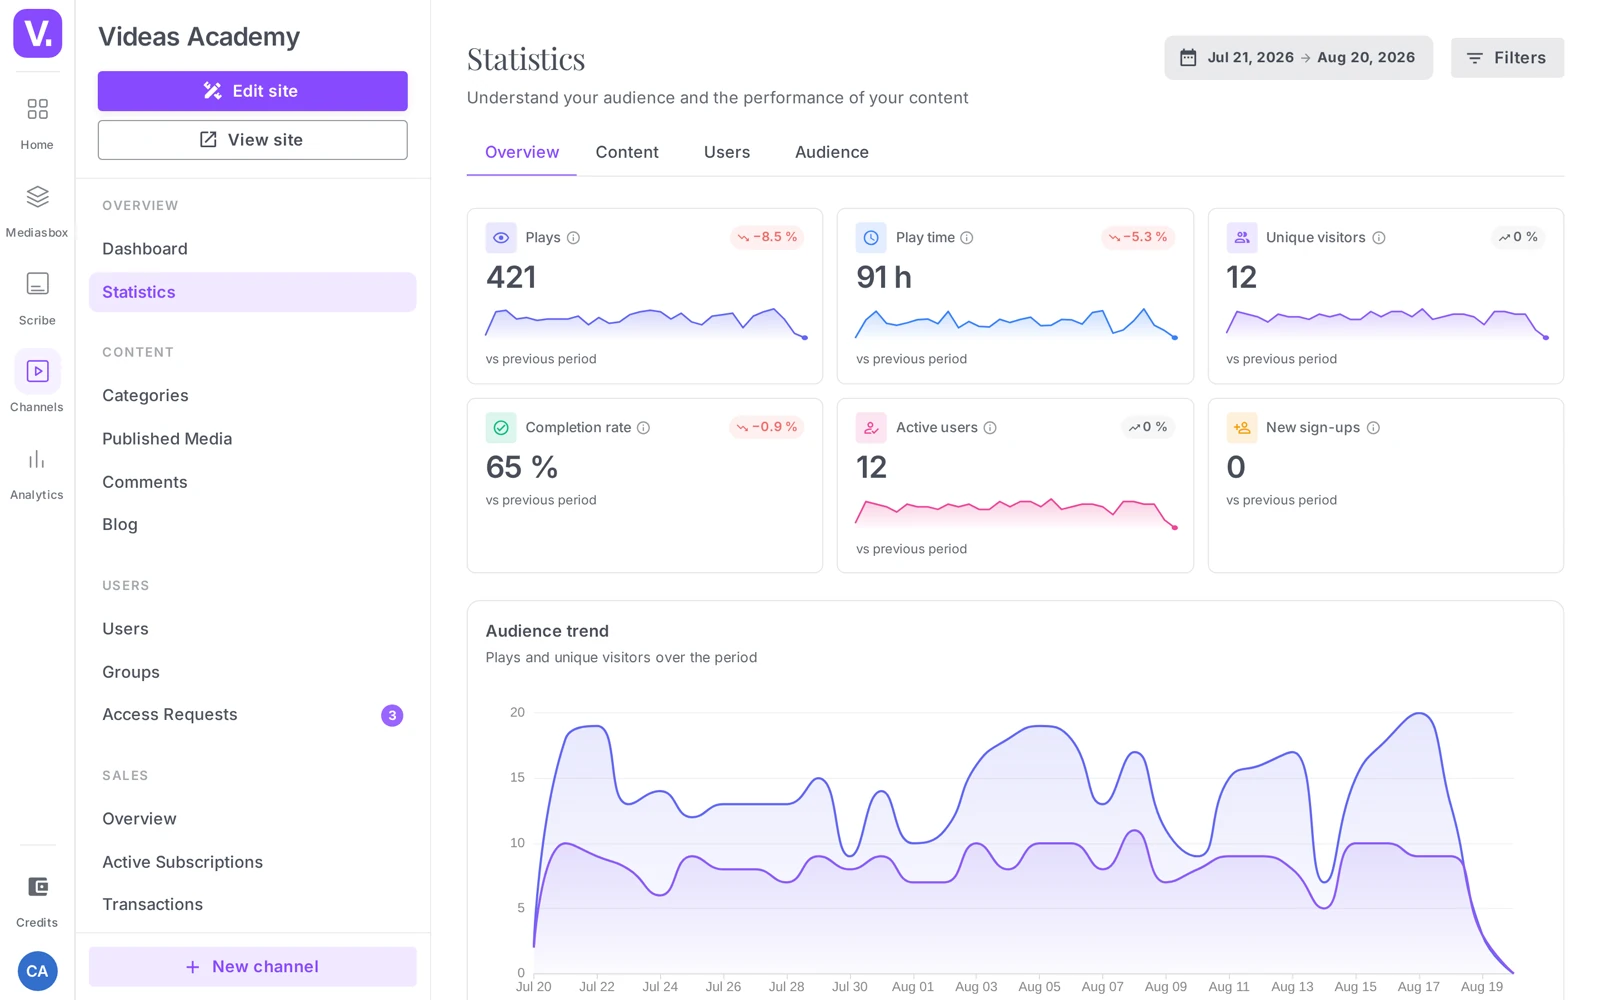
The key metrics (KPIs)
Depending on the tab, cards show: Plays, Watch time, Unique visitors, Completion rate (the average share of the content watched before stopping), Average session duration, Active users (registered users who watched content during the period), Registered users and New registrations. Every KPI is compared with the previous period.
The four tabs
Overview
The summary: the Audience trend chart (plays and unique visitors over the period), Most-watched content and Most active users.
Content
The Most-watched content ranking (“Click a column to sort”), with the columns Content, Plays, Unique visitors, Watch time and Completion, plus a Top categories block. Ideal for spotting what works — and what deserves better placement on your home page.
Users
The Most active users ranking, sortable, with the columns User, Watch time, Content, Sessions, Completion and Last activity. A Registered only switch limits the analysis to your accounts.
Audience
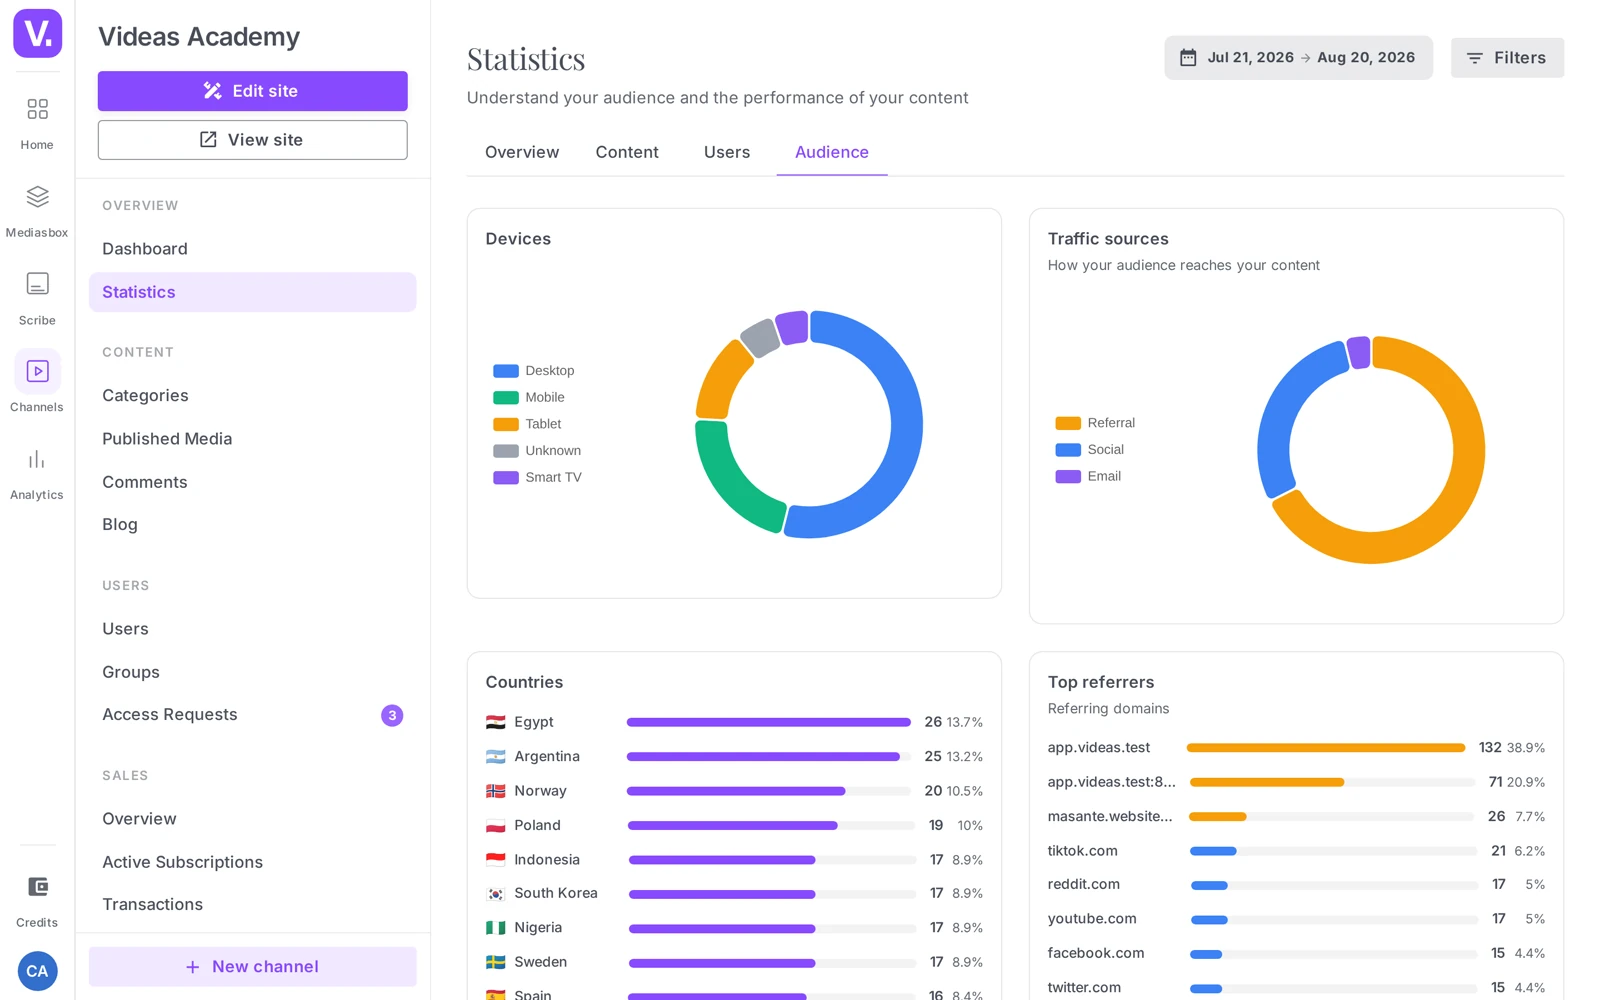
The make-up of your audience: Devices (Desktop, Mobile, Tablet, Smart TV, Games console), Countries, Traffic sources (Direct, Social, Organic search, Referral, Email, Paid), Top referrers, and a peak hours map (activity by day and by hour).
Analytics for a single user
Every registered user has their own viewing analytics. From Users, open a user’s profile then the Analytics tab (“Viewing analytics” — “This user’s activity on your channel”). See also Manage your channel users.
There you find:
- the Member since / Last activity header;
- summary cards: Total watch time, Content watched, Sessions, Average completion, First visit, Last activity;
- Activity over time, Watch history (session by session: Content, Watched on, duration, Completion, Device), Favorite content, Favorite categories, Devices and Locations.
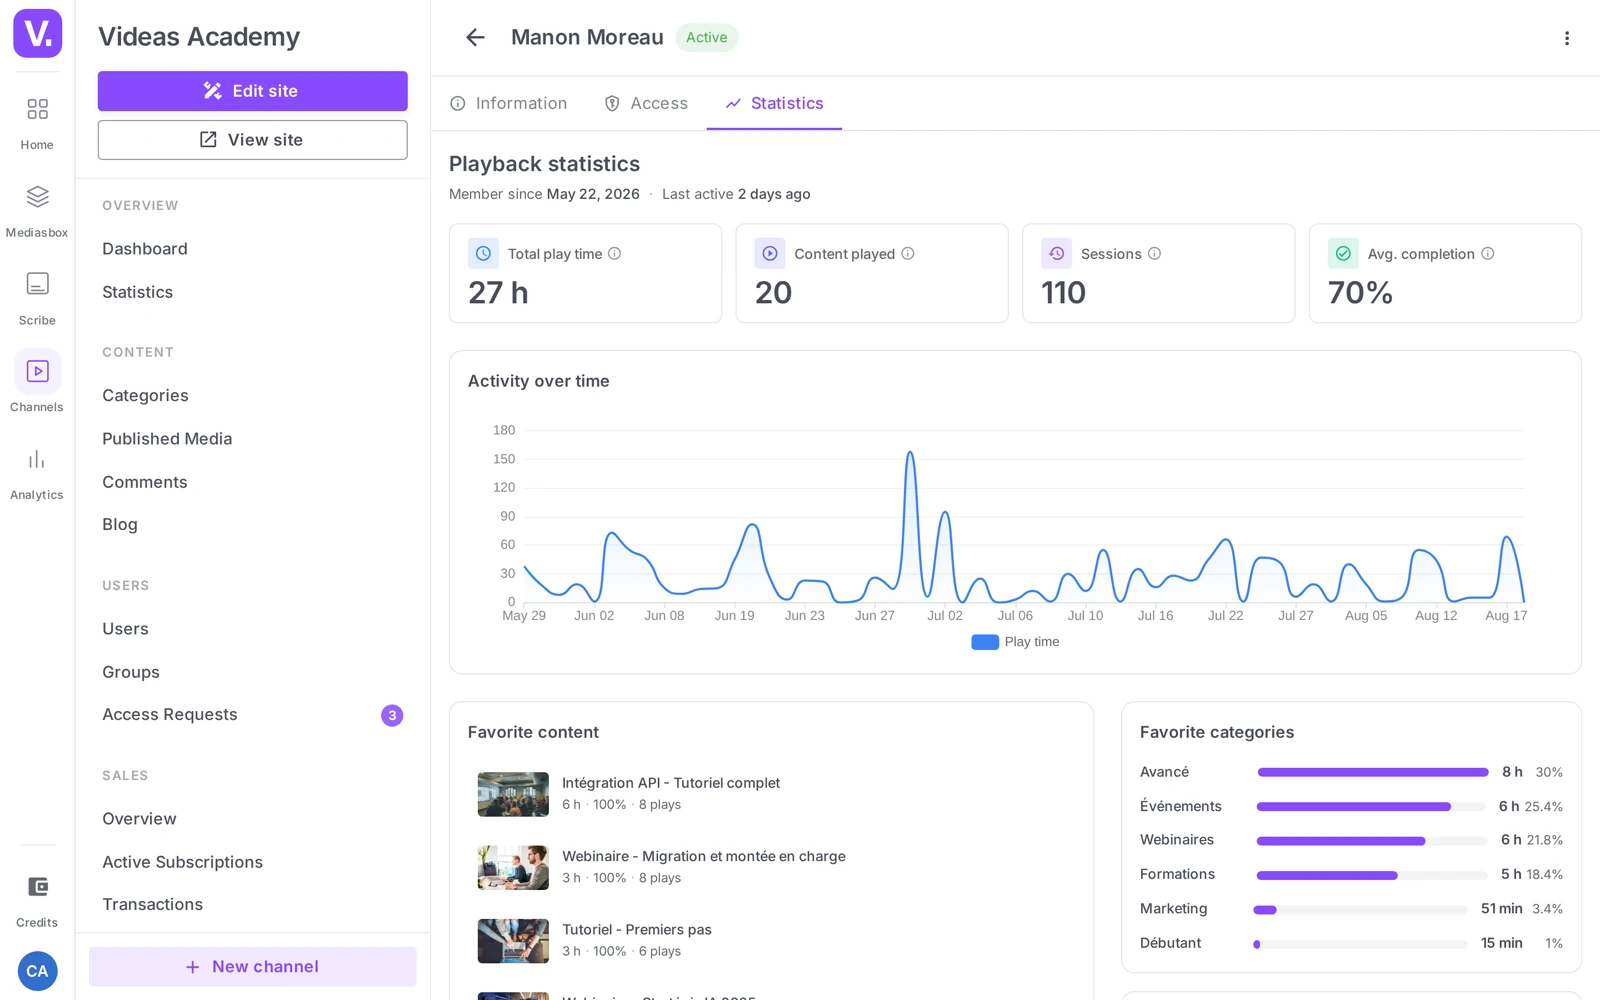
Good to know: these individual analytics are valuable for training or B2B use — knowing who really watched what content, how far, and when.
Best practices
- Settle on a consistent period before comparing: 30 days for day-to-day tracking, 12 months for underlying trends.
- Combine the filters: Audience = Registered plus a country or a content type isolates a precise segment.
- Use the Content tab to decide what to feature in the Page Builder, and the Audience tab to work out where to communicate (traffic sources, peak hours).
- For revenue (subscriptions, purchases, transactions), look in your channel’s Sales section rather than here.
Where do I see my channel’s revenue?
Not here. The Analytics section measures audience — plays, visitors, watch time, completion. Revenue, subscriptions and transactions are found in your channel’s Sales section.
It is a clean, deliberate separation: the two dashboards answer different questions, and looking for an amount in the audience analytics is the most common false trail.
How does this differ from a video’s analytics?
A question of scope. Channel analytics measure the audience of your site: visitors, registered members, traffic sources, peak hours. Video analytics measure the performance of your content, wherever it is played — including off the channel, in an embed or through a link.
A third dashboard exists as well, for a share link, answering a narrower question: who opened and watched that particular link.
What does “Active users” mean?
Registered users who played content during the chosen period — not the total number of accounts. It is the indicator that separates a live base from a dormant one.
It reads alongside two others: Registered, the total of accounts, and New registrations, those who arrived during the period. A widening gap between registered and active signals an audience that signs up and does not return — the subject is then onboarding, not acquisition.
How do I isolate a specific segment?
By crossing the filters in the Filters drawer. The Audience filter switches between Everyone and Registered; Devices, Countries and Content types (Video, Audio, Article) come on top.
A badge shows how many filters are active, and Clear resets them at once — useful when a figure looks abnormally low and a forgotten filter is the cause.
Which period should I choose?
Thirty days for routine monitoring, twelve months for underlying trends. The periods offered run from 7 days to 12 months, with a custom range.
The thing to watch is the comparison: every indicator is set against the previous period. Changing the period therefore changes the reference too, and comparing two readings taken over different periods makes no sense.
Can I see what one specific user watched?
Yes, from their profile: open Users, select the person, then the Analytics tab. You will find their total watch time, the content they played, their sessions, their average completion, their first and last visit.
The detail goes further: a viewing history session by session (content, date, duration, completion, device), favourite content, preferred categories, devices and locations. That is valuable in training or B2B use, where you need to know who actually followed what, and how far.
What is the peak-hours map for?
To know when your audience is there, by day and by hour. It is the information that settles a publication time, a campaign send or a live broadcast.
It lives in the Audience tab, alongside the breakdown by device, by country, and above all the traffic sources — direct, social, organic search, referral, email, paid — which tell you where your communication actually lands.
In summary
- The channel’s Analytics section offers a real dashboard (GDPR-compliant), with a period selector and Filters (Audience, Devices, Countries, Content types).
- KPIs: Plays, Watch time, Unique visitors, Completion rate, Average session duration, Active users, Registered users, New registrations (vs the previous period).
- 4 tabs: Overview, Content (top content + top categories), Users (the most active), Audience (devices, countries, traffic sources, peak hours).
- Per user: a user’s profile → the Analytics tab details their watch time, sessions, history, and favorite content and categories.
- Revenue is found in the Sales section, not here.
Related articles
Screenshots were taken on Videas Academy, an example channel built for this help center. It belongs to a fictional customer, not to Videas: your own channel carries your name, your branding and your prices.