Analyze the geographic breakdown of your viewers
The Geography tab in your analytics shows where your plays come from: which countries and continents watch your content. It is what helps you decide whether to invest in subtitles, adjust your publishing times or target a specific area.
Open it from the Analytics menu (for a whole workspace) or from the Analytics tab of a video (for that video alone), then the Geography tab. The Period filter applies here as it does everywhere.
How location is determined
The location of each play is derived from the viewer’s IP address, matched against a geographic database. This works for every viewer, signed in or not.
- The country is reliable in the vast majority of cases; the continent is reliable by construction.
- Attribution happens per session, aggregated and anonymized: no raw IP address is stored or displayed, and no third-party tracking cookie is set. You see trends by market, not individuals.
The key metrics
At the top of the tab, four metrics summarize how international your audience is (each with its change vs. the previous period):
| Metric | What it measures |
|---|---|
| Total countries | Number of distinct countries that played your content during the period |
| Top country | The country that weighs the most (with its share of the total) |
| Top continent | The continent that weighs the most |
| Avg. plays per country | Average number of plays per country (a spread indicator) |
The world map and the breakdown by continent
A world map colors each country by play intensity: the darker a country, the more it weighs; countries with no data stay light grey. Hover over a country to see its details.
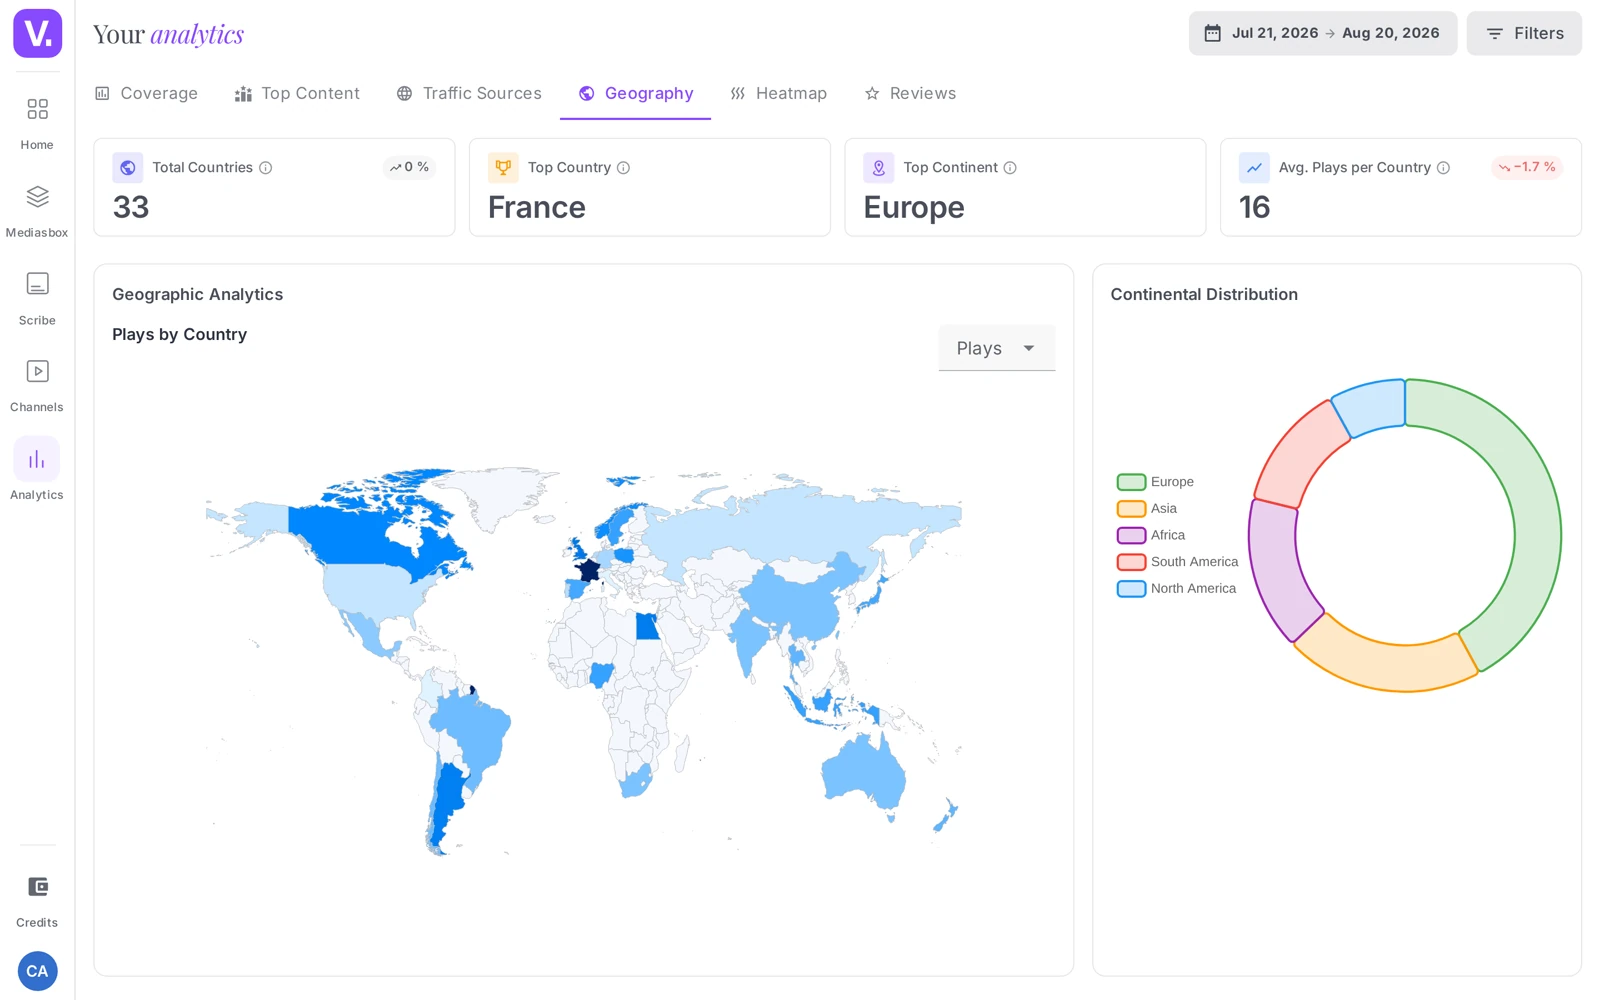
Next to it, the breakdown by continent shows each continent’s share as a donut. A new French-speaking channel typically shows 100% Europe; seeing that figure drop in favor of other continents is a sign that you are going international.
Top countries
The Top countries table ranks countries by number of plays. For each one:
| Column | Content |
|---|---|
| Country | Flag + name |
| Plays | Number of plays during the period |
| Unique audience | Distinct viewers |
| CTR | Click-through rate in that country |
| Avg. duration | Average watch time per session |
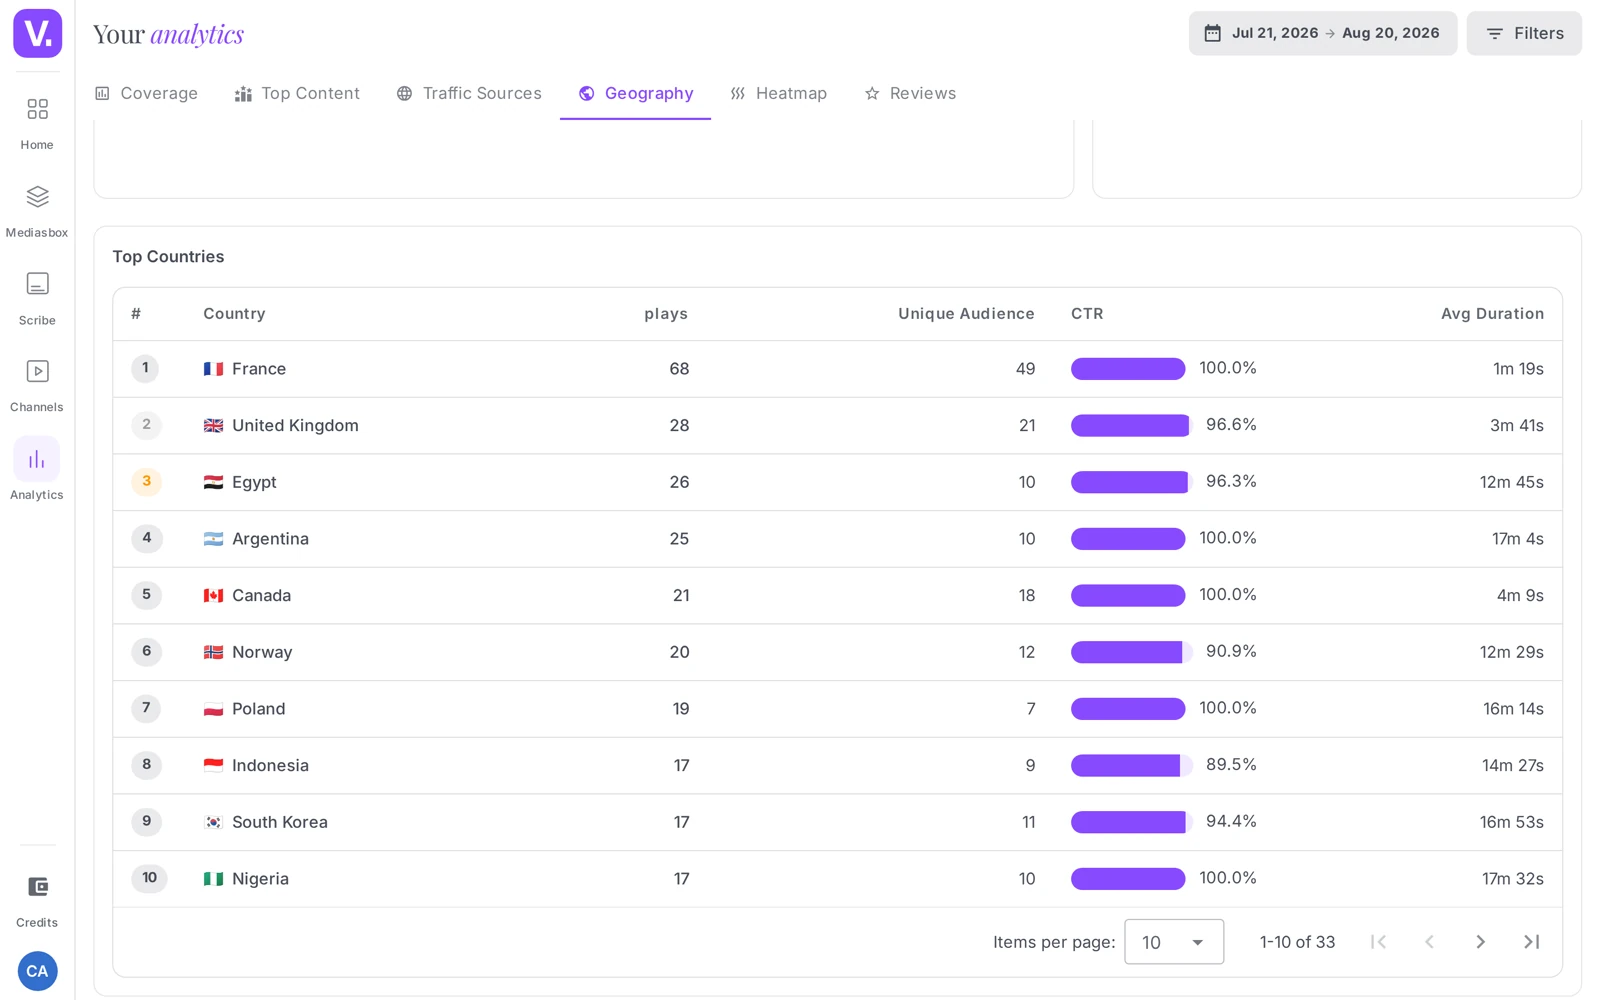
CTR trap on small volumes: a country with 5 impressions and 5 plays shows a CTR of 100% — that does not make it a better market than a country with 10,000 impressions and 3,000 plays. Always look at the play volume before drawing conclusions.
What it is for
- Translating your subtitles: if a non-French-speaking country goes above ~5% of your audience, a translation becomes worth the cost (see Translate a video’s subtitles).
- Adjusting your publishing times: a North American audience does not watch at the same hours as a French one.
- Targeting a campaign locally rather than globally.
What this view does not show
- Country and continent only — there is no breakdown by city or region. For the international picture, think at country level.
- Attribution by IP, not by account: a viewer who is traveling or behind a VPN is attached to the country of their connection. Expect a little noise on mobile or tech-savvy audiences.
- Aggregated data, not individual: you see how a market behaves, not who watches what.
Why measurement stops at country level: the Analytics product page explains the choice — measuring an audience without tracking individuals.
How does Videas know my viewers’ country?
From the connection’s IP address, matched against a geographic database — which works for every viewer, signed in or not. The country is reliable in the vast majority of cases, and the continent is so by construction.
Attribution happens per session, aggregated and anonymised: no raw IP address is stored or displayed, and no third-party cookie is set. You see trends by market, not individuals.
Can I see the breakdown by city or region?
No. The view stops at country and continent: there is no city detail and no regional split. For the international dimension that is the right granularity; for local analysis you have to look elsewhere.
That is consistent with the anonymised approach: going down to city level would make some audiences re-identifiable on small volumes.
At what share of audience is it worth translating subtitles?
A useful marker: past roughly 5% of your audience coming from a country that does not speak your language, translation becomes worthwhile. Below that, the production and maintenance effort generally outweighs the gain.
The signal to watch is less the absolute value than the trend. A young French-language channel typically shows 100% Europe; seeing that figure fall in favour of other continents is the real marker of internationalisation under way.
Why does a small country show a 100% CTR?
Because click-through rate means nothing on small volumes. A country with five impressions and five plays shows 100% — which does not make it a better market than one with ten thousand impressions and three thousand plays.
The rule: always look at the Plays column before drawing a conclusion from a rate. CTR only becomes usable past several hundred impressions.
Does a viewer behind a VPN distort the figures?
A little, yes. Attribution uses the connection IP, not the account: a viewer travelling or behind a VPN is assigned to the country they connect from, not the one they live in.
Expect some noise on highly mobile or highly technical audiences. It does not undermine the underlying trends — a market that takes off does so over hundreds of sessions, not a handful of unusual connections.
In short
- The Geography tab shows where your plays come from, by country and continent (IP-based location, anonymized, GDPR-compliant)
- 4 metrics: Total countries, Top country, Top continent, Avg. plays per country
- World map + breakdown by continent (donut) + Top countries (Country, Plays, Unique audience, CTR, Avg. duration)
- No city/region breakdown; attribution per session, not per account
- Always read CTR together with the play volume
Related articles
Screenshots were taken on Videas Academy, an example channel built for this help center. It belongs to a fictional customer, not to Videas: your own channel carries your name, your branding and your prices.