3,000 hof content watched every month
Watch time, not clicks
A million player visits and a hundred thousand unique viewers a month: the dashboard tells the three apart, and shows which careers videos are watched to the end.
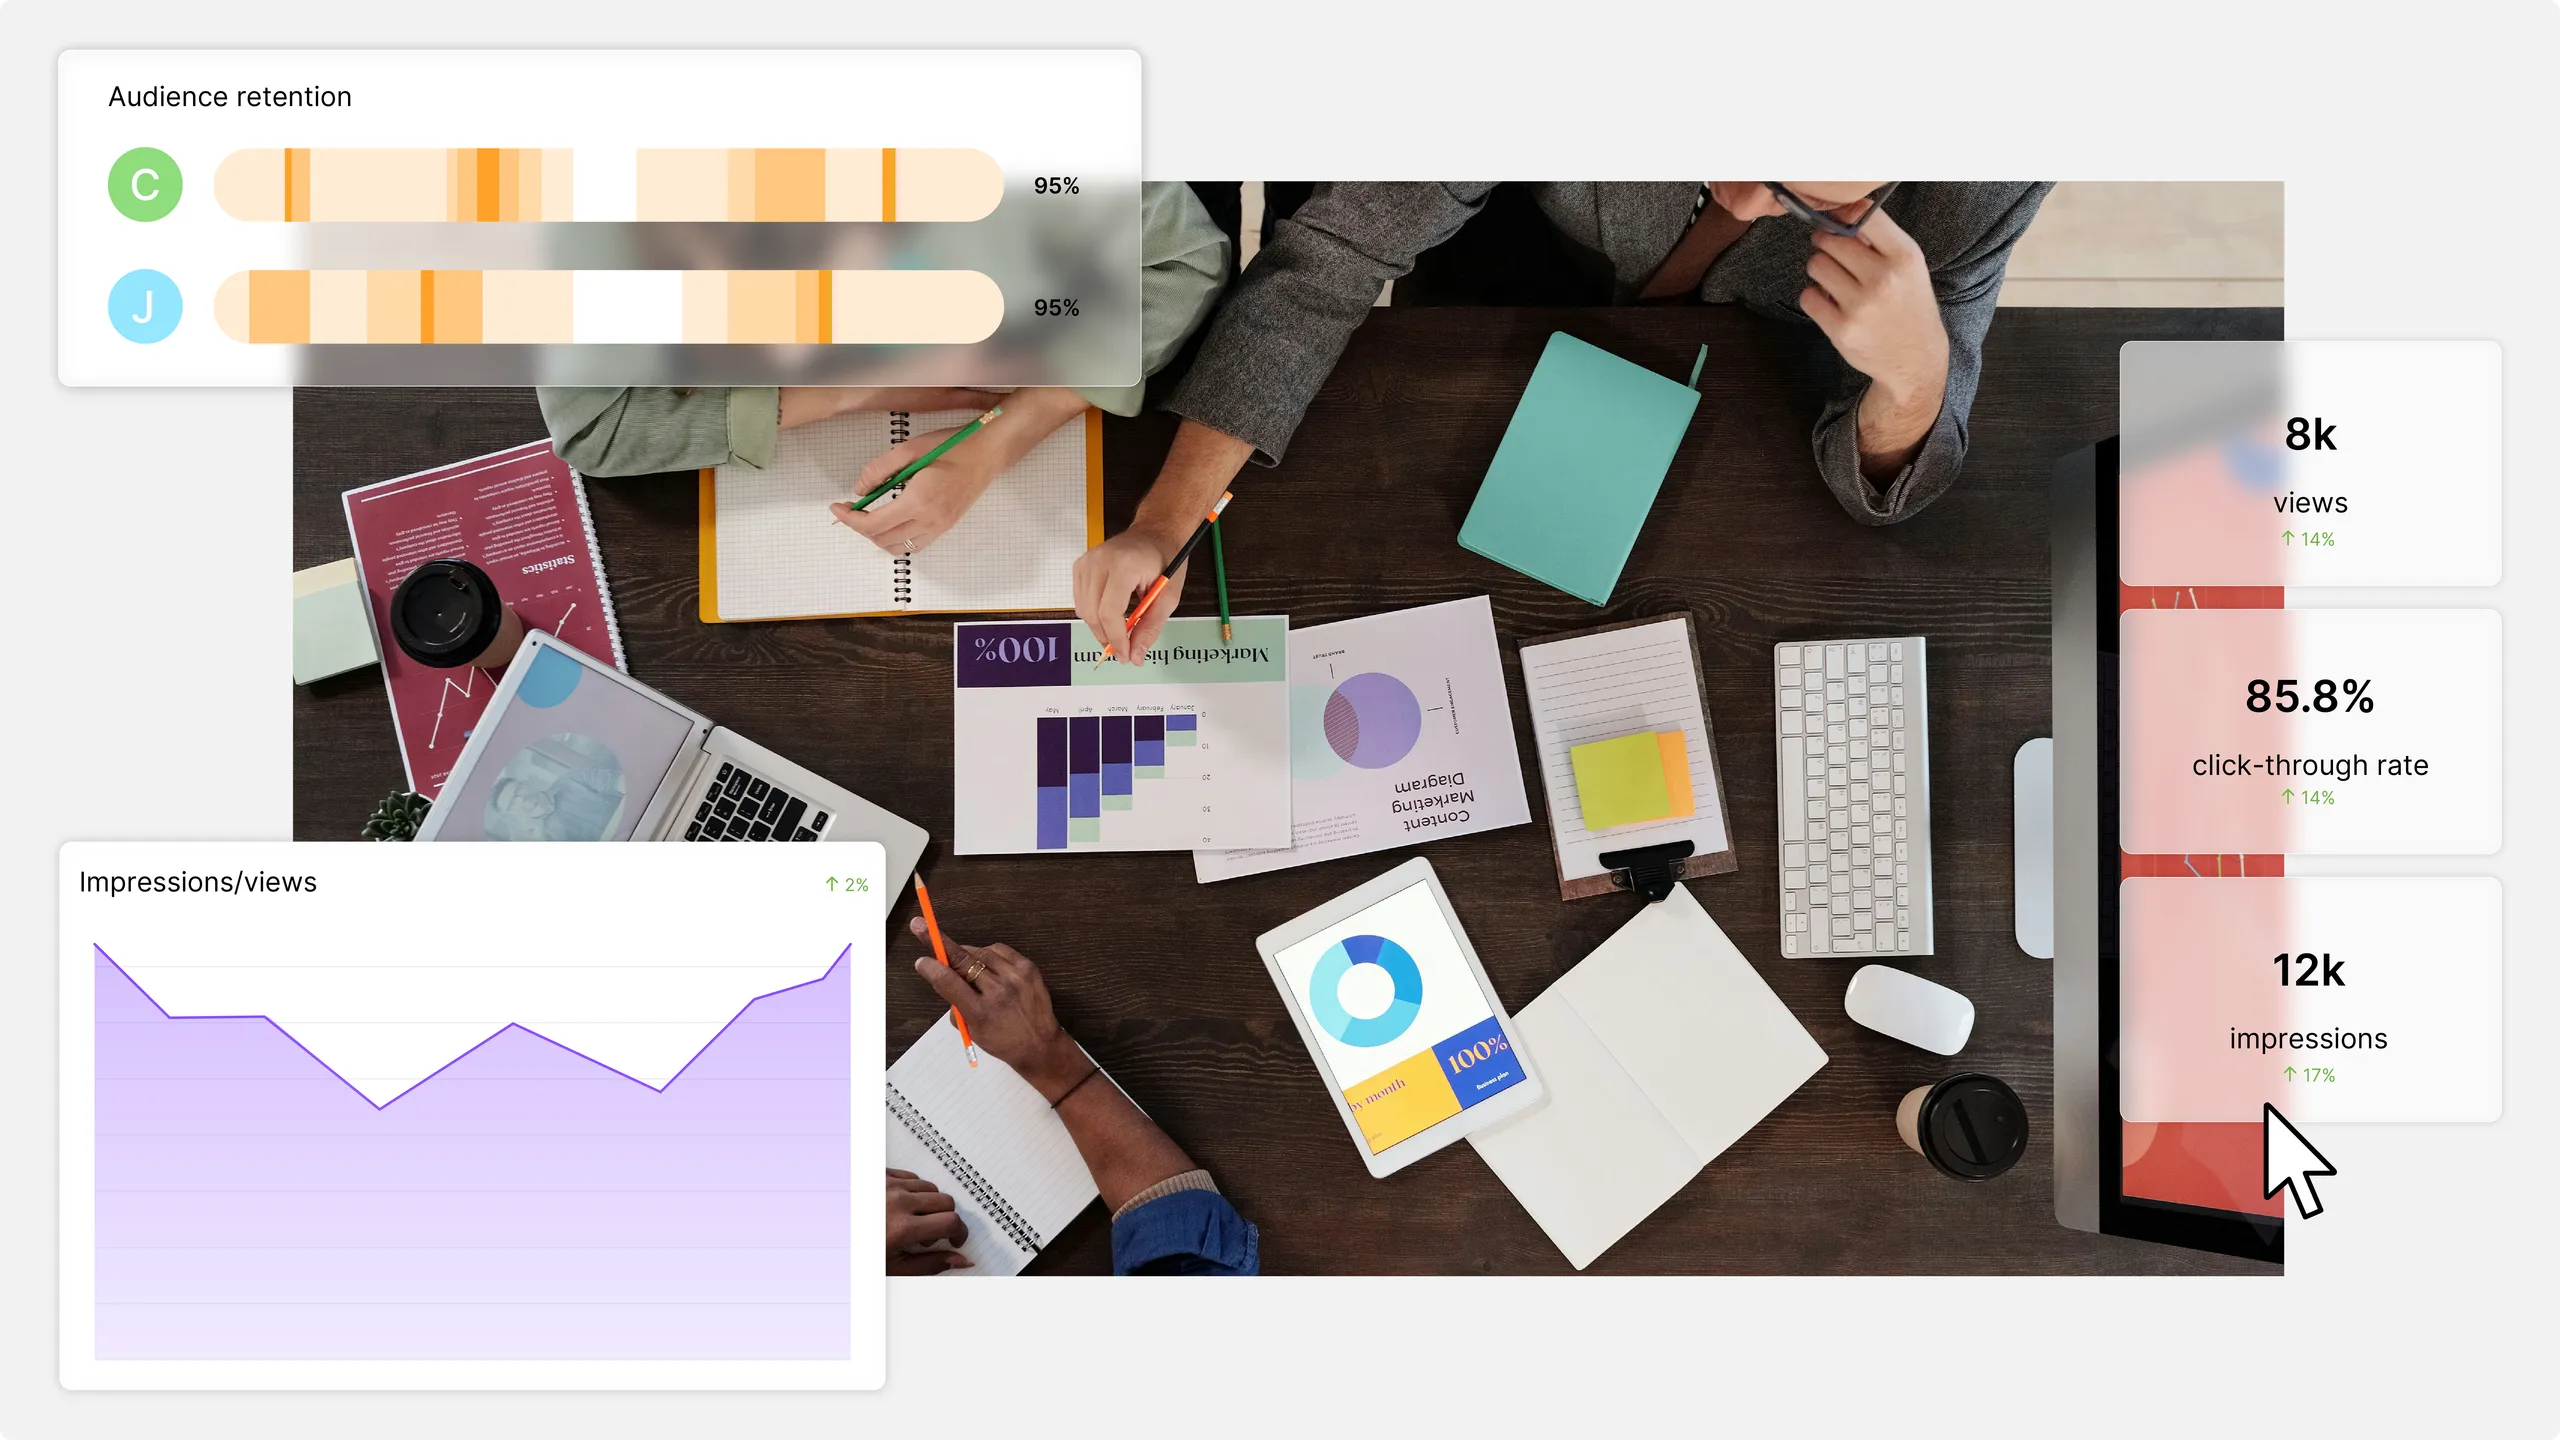
How many plays, how far in, from which sites and which countries: the Videas dashboard measures your video audience, and the heatmap shows where it drops off. No third-party cookie, no advertising pixel, and nothing to change in your consent banner.
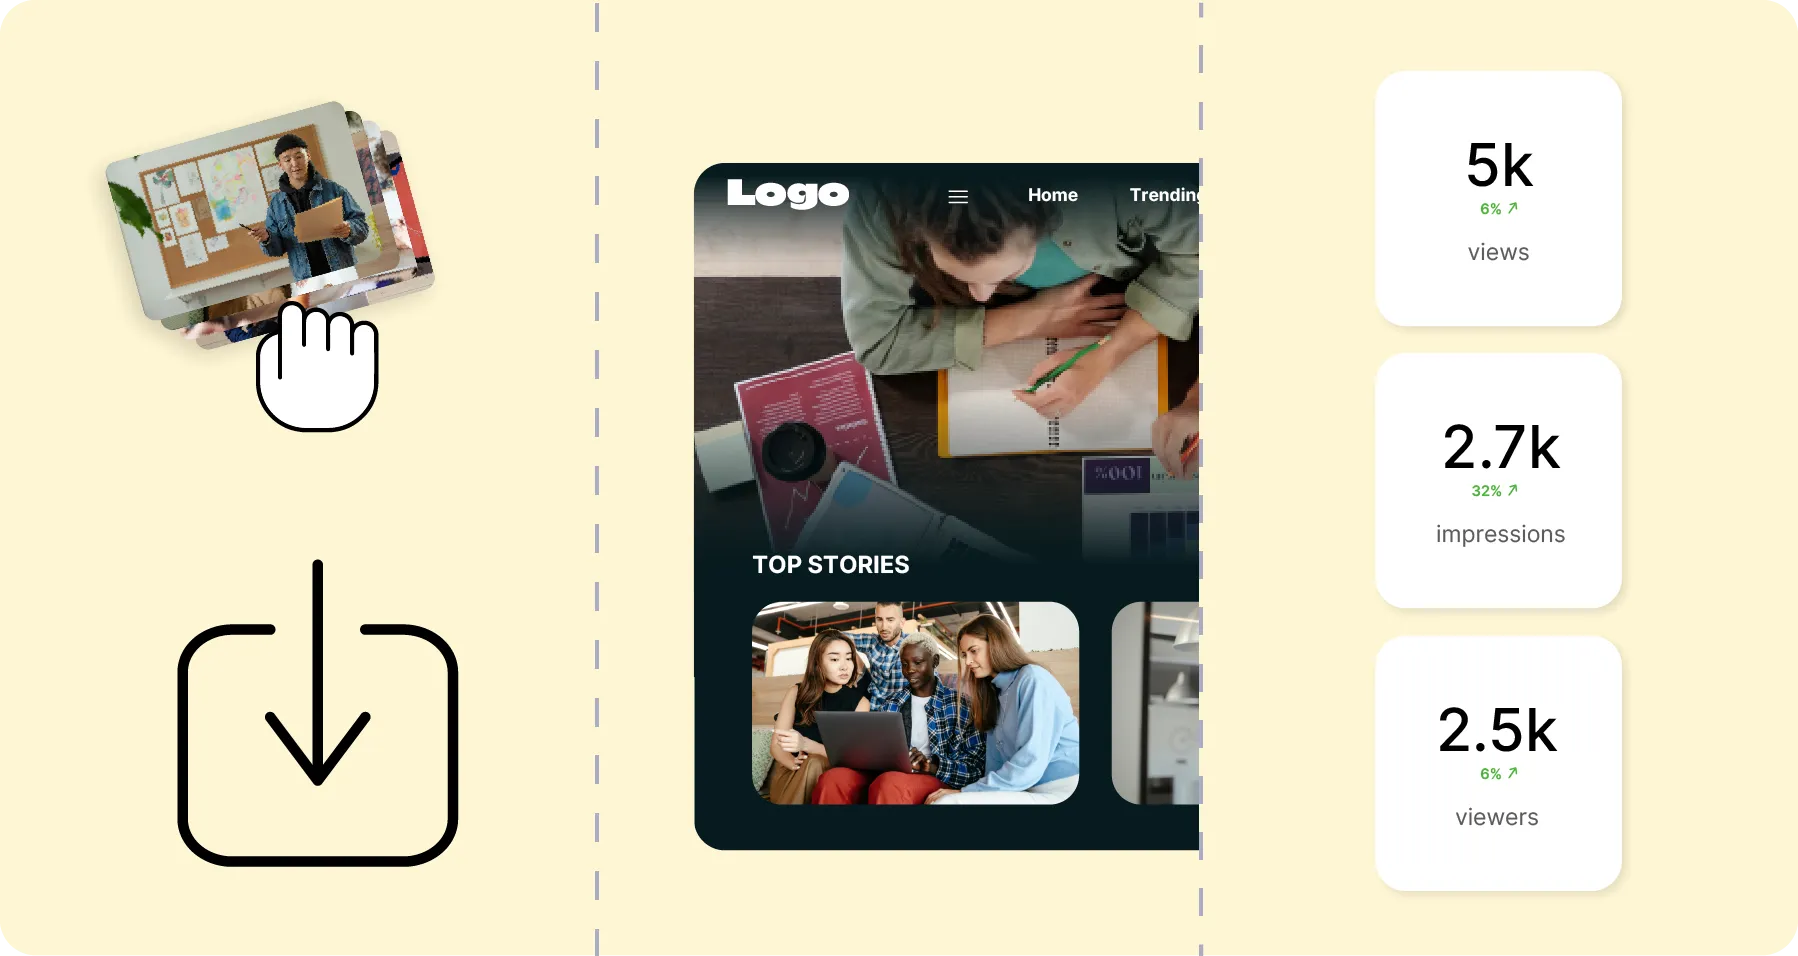
Upload your videos to Mediasbox and distribute them. Measurement starts on its own with the first play: no script to install, no third-party account to open, no tag to add to your pages.
Embed on your site, a Videas channel, a share page or a direct link: every channel is tracked separately, and the sites showing your videos are named in the Traffic sources tab.
Open the Analytics menu, pick a period, combine the filters. The eight metrics, the top content table and the heatmap point at what to fix: a thumbnail, an intro, a running time.
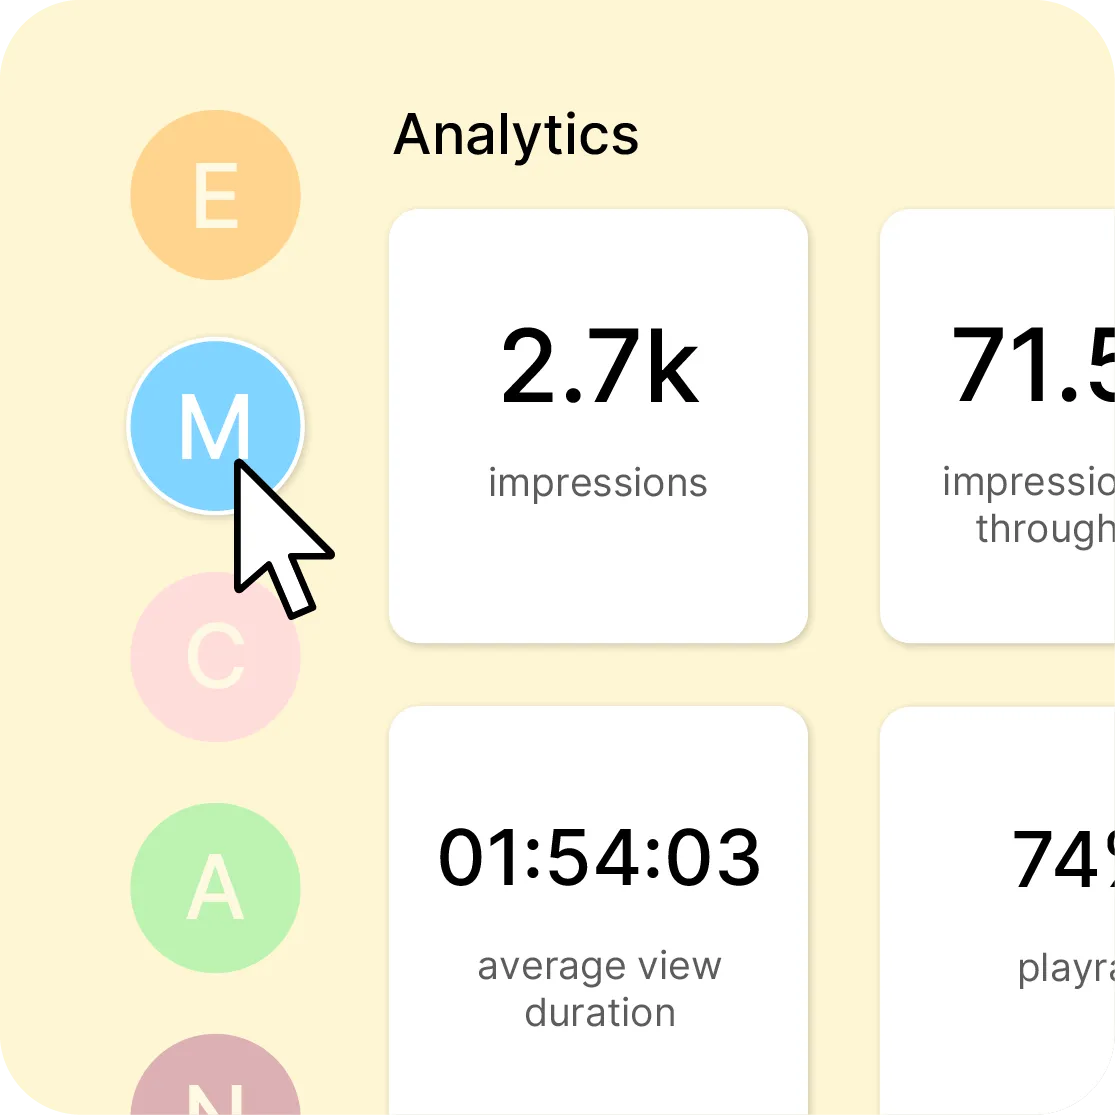
Videas counts plays, not people: measurement is aggregated by session, the country is inferred from the IP address without any raw address being kept, and nothing is written to your viewers' browsers. The Reach tab gathers eight metrics — impressions, plays, click-through rate, average watch duration, unique audience, total watch time, completion rate and number of media — each compared with the previous period. Three more tabs go deeper: the heatmap shows where your audience leaves the video, geography shows where plays come from, and traffic sources list the sites where your videos are watched. And inside a channel where your viewers have an account, measurement becomes named: who watched what, and how far in.
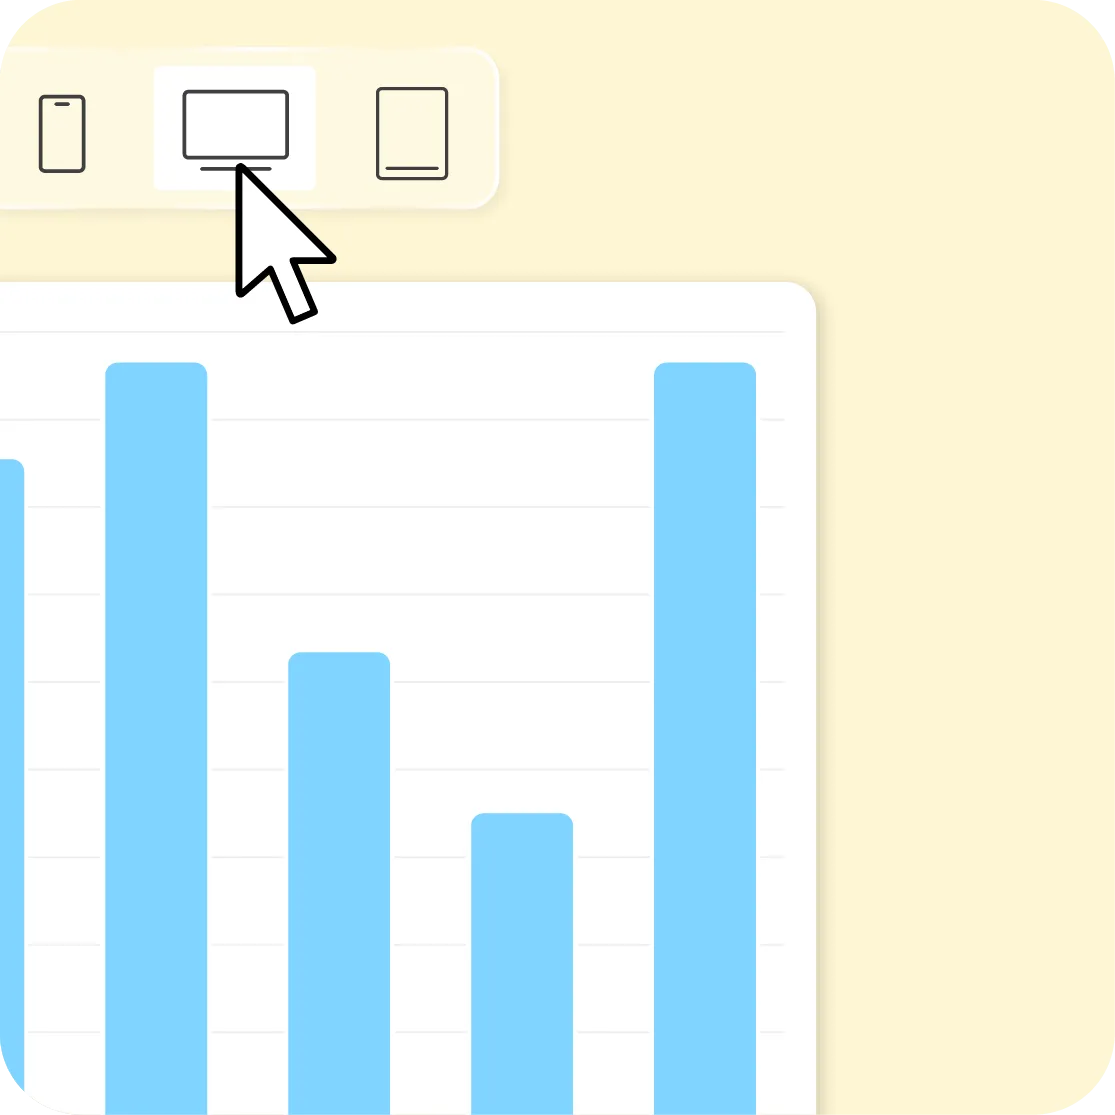
The Reach tab gathers impressions, plays, click-through rate, average watch duration, unique audience, total watch time, average completion rate and number of media, each compared with the previous period. Below, four charts follow plays, devices, unique audience and watch time over time. A period selector offers eight presets and a custom range; a filter panel adds content type, device, country and workspace. The Export button downloads the view on screen, period included.
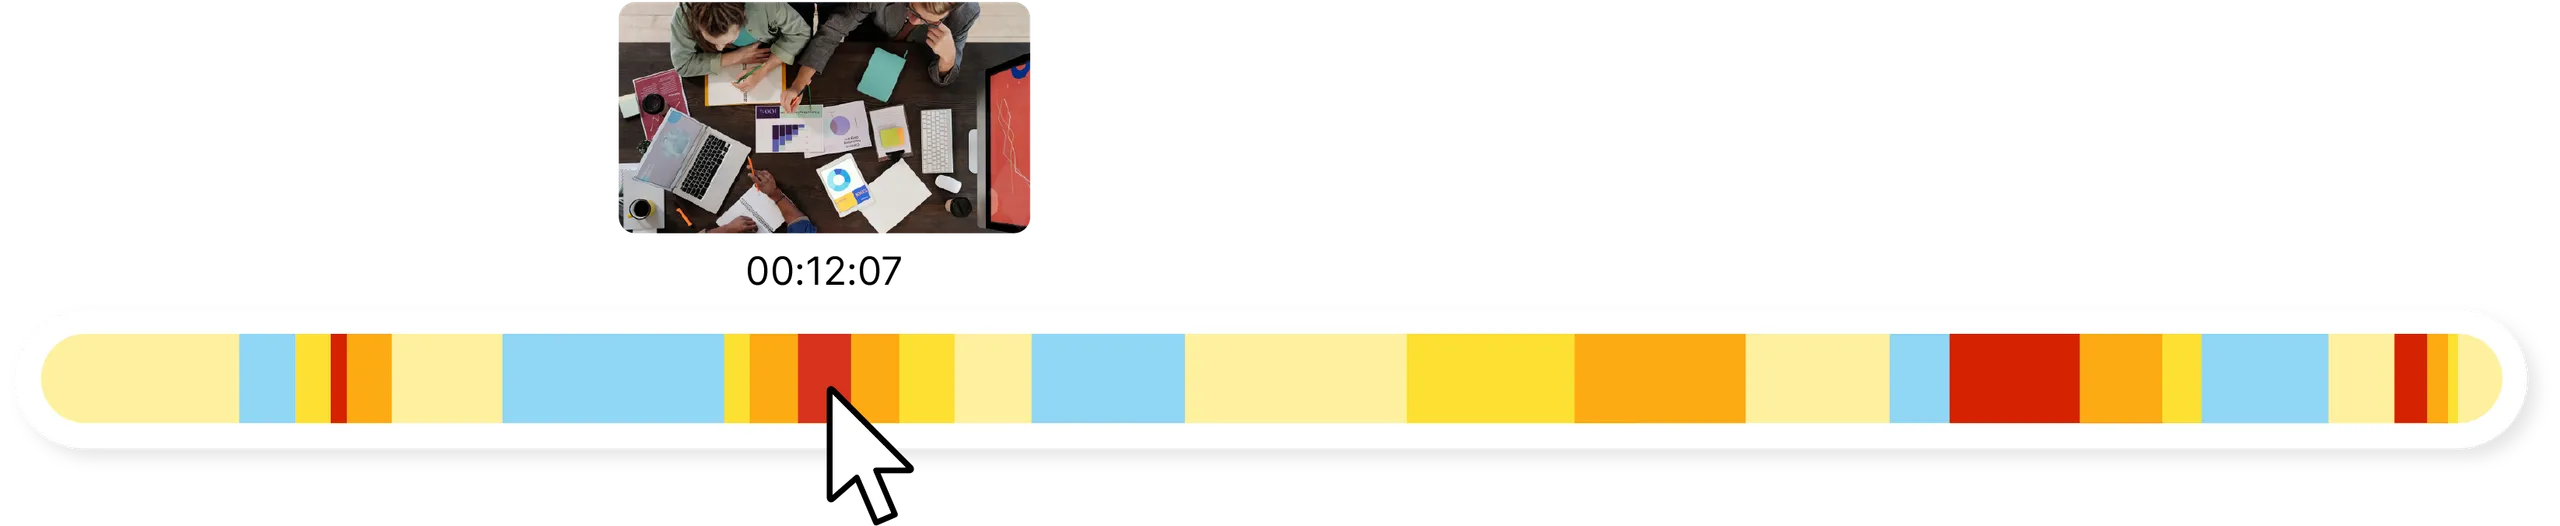
The engagement curve follows play density along the video: how many viewers are still there at each moment, and when they go. The engagement peak marks the most-watched segment. When detailed data exists, a recent sessions table adds forward and backward skips, device and country. A drop in the first seconds accuses the intro; a local rise marks a passage people come back to, and makes a good chapter.
The Traffic sources tab lists the external domains where your videos are played, then drills down three levels: the site, the exact pages of that site, and the media watched there. You no longer read "this blog brings me 300 plays" but "this article concentrates 250 of them, on this video". And in a channel where your viewers sign in, a Users tab ranks the most active ones — watch time, content, sessions, completion, last activity — with a session-by-session history on each profile.
3,000 hof content watched every month
A million player visits and a hundred thousand unique viewers a month: the dashboard tells the three apart, and shows which careers videos are watched to the end.
100%GDPR: measured without a single cookie
The agency allows no cookie and no tracker on its regional sites; its statistics still filter site by site and territory by territory.
10,000+employees, and a participation rate tracked
The bank's internal Web TV is authenticated: attendance at the weekly video sessions is tracked over time, and it has been rising since launch.
Your media ranked over the period: plays, impressions, click-through rate, unique audience, average duration, completion and trend. Sortable by any column, from the top 10 to the whole catalogue.
Four charts follow plays and impressions, the device mix, unique audience and watch time. Every metric is set against the previous period, which makes a spike readable without any arithmetic.
A world map shaded by intensity, the share of each continent, and a top-countries table with plays, unique audience, click-through rate and average duration. Enough to decide where to translate, and when to publish.
The split between desktop, tablet, mobile, smart TV and games console, and how it moves. Enough to set a format, a running time and the player settings against how your audience actually watches.
No advertising cookie, no third-party tracker, no pixel: only the technical elements strictly needed for playback are used. You have nothing to add to your consent banner, for the player or for its analytics.
A video embedded on a site, published in a channel, sent as a link or placed on a page: the plays all land in the same dashboard, with no tool to switch and no exports to stitch together.
Analytics measures an audience, not people: outside a channel where your viewers have an account, you read countries and trends, never a name. The country comes from the IP address, so a viewer travelling or behind a VPN is counted elsewhere, and there is no city or region. The heatmap is as candid: on recent content, second-by-second capture is not in place yet and the curve is estimated from the average completion rate. The summary metrics, for their part, stay real.
€0
for the dashboard, the heatmap and the export
€0
per member, however many there are
€0.20
per hour of video stored, every month
Analytics has no line on the invoice: no licence, no viewer tier, no surcharge for the heatmap or the export. It starts with the first play, and any member of the organisation can open it. You pay for what you store and what your viewers watch — €0.20 per hour of video stored each month, €0.02 per gigabyte delivered beyond the free terabyte. You receive €5 of credits on sign-up, then €5 every month.
"Your solution is high quality, your team is responsive and attentive, and the results more than meet our expectations."

"The rigor, availability and responsiveness VIDEAS shows are exemplary. Feedback from users of my VOD site is very good too."

"The interface meets our expectations in every respect. Simple, affordable and easy to use — we are delighted with it."

"Videas is the ideal platform to store our videos and run a custom channel for our media outlet."

"Videas is an easy platform to get to grips with, and it lets you create a VOD channel quickly. The team listens and is very responsive."

The Reach tab shows eight metrics: impressions, plays, click-through rate, average watch duration, unique audience, total watch time, average completion rate and number of media, each compared with the previous period. Three further tabs add geography, the sites that embed your videos, and the engagement heatmap.
Only inside a channel where your viewers have an account. There, a Users tab ranks the most active ones, and each profile details watch time, sessions, viewing history and average completion. Everywhere else, measurement stays aggregated: audience trends, never individuals.
Play density along the video: at which moments your audience is still there, and where it leaves. It also gives the engagement peak, and a recent sessions table with forward and backward skips. It exists only for time-based media, video and audio.
No. The player sets no advertising cookie and no third-party tracker: only the technical elements strictly needed for playback are used, and plays are aggregated by session. So you have nothing to add to your consent banner, for the player or for its analytics.
Yes. An Export button downloads the data for the view and period on screen, as CSV or a spreadsheet, to cross-check elsewhere or archive a report. Developers can also pull their analytics through the Videas API, with a token created from Settings then API access.
Your numbers stay yours: they feed no advertising network and are shared with nobody. You measure your videos wherever they are played, including embedded on third-party sites, and you get the list of those sites — which an audience platform does not give you.
Almost. Plays are collected as they happen and the dashboard refreshes regularly, which is enough to follow a publication or a campaign the same day. Watch the period selector: set to the last thirty days by default, it sometimes hides what has just happened.
Yes. The period selector offers eight presets, from today to last year, plus a custom range. A Filters panel adds content type, device — desktop, tablet, mobile, smart TV, games console — country and workspace. Filters combine, and a single click clears them all.
Any member. A video's analytics are visible to anyone in the organisation, and the Analytics menu asks for nothing more than membership. That is a deliberate choice: these numbers drive editorial decisions, and reserving them for administrators would deny them to the people making the videos.
In the EU, on servers subject to the GDPR, with no transfer outside the European Union. No raw IP address is kept: it serves only to infer a country, and the play is then aggregated by session. A dedicated data protection officer oversees the whole platform.


