See who watches your videos, and how far they get
To view your analytics in Videas, two entry points lead to the same dashboard: the Analytics app (side menu) for your whole organization or for one workspace, and the Analytics tab on a video’s record for that video alone. There you see how many times your content is played, by whom, how far, and where the plays come from.
The data is real (computed on actual plays), with a Period filter that refreshes the whole screen. This article covers the Reach tab (the summary metrics), Top content and Reviews; geography, delivery domains and the heatmap have their own articles.
Three analytics dashboards in Videas — depending on what you are looking for:
- Your videos and content (plays, completion, geography, delivery sites): this article.
- Your channel (your site’s audience, registered members): Understand your channel analytics.
- A share link (who opened and watched one specific link): Share link analytics (section “View a link’s analytics”).
Where to find your analytics
- For a whole workspace or the organization: click Analytics in the side menu. From a workspace, the View analytics button opens the stats already filtered on that workspace.
- For one specific video: open the media record, then the Analytics tab. Every view is then filtered on that video.
Who has access: the analytics of a video are visible to every member of your organization. Global analytics (the Analytics menu) simply require being a member of the organization — they are not restricted to administrators.
Choosing the period and the filters
At the top of the screen, the Period selector applies to all the data. Presets: Today, Yesterday, Last 7 days, Last 30 days (default), This month, Last month, This year, Last year, or a custom period. Changing the period refreshes the whole screen.
The Filters button opens a panel to refine the analysis:
- Content type — Video or Audio
- Devices — desktop, tablet, mobile, smart TV, console
- Countries — a selection of the main countries
- Workspaces — to combine several workspaces (at the global level only)
The Reach tab
Reach is the overview. At the top, eight key metrics summarize activity over the period; each one also shows its change vs. the previous period.
| Metric | What it measures |
|---|---|
| Impressions | Number of times the content was displayed (thumbnail, suggestion…) |
| Plays | Number of times the content was actually played (an engaged play, beyond a few seconds) |
| Click-through rate | Share of impressions that led to a play (Plays / Impressions) — how effective your thumbnails and titles are |
| Avg. watch duration | Average time spent per play |
| Unique audience | Number of distinct viewers during the period |
| Total watch time | Cumulative time spent on your content |
| Avg. completion rate | Average percentage of the content watched before stopping |
| Media | Number of media included in these analytics |
Below these metrics, four charts show how things evolve over time: Plays and impressions, Breakdown by device, Unique audience over time and Watch time over time.
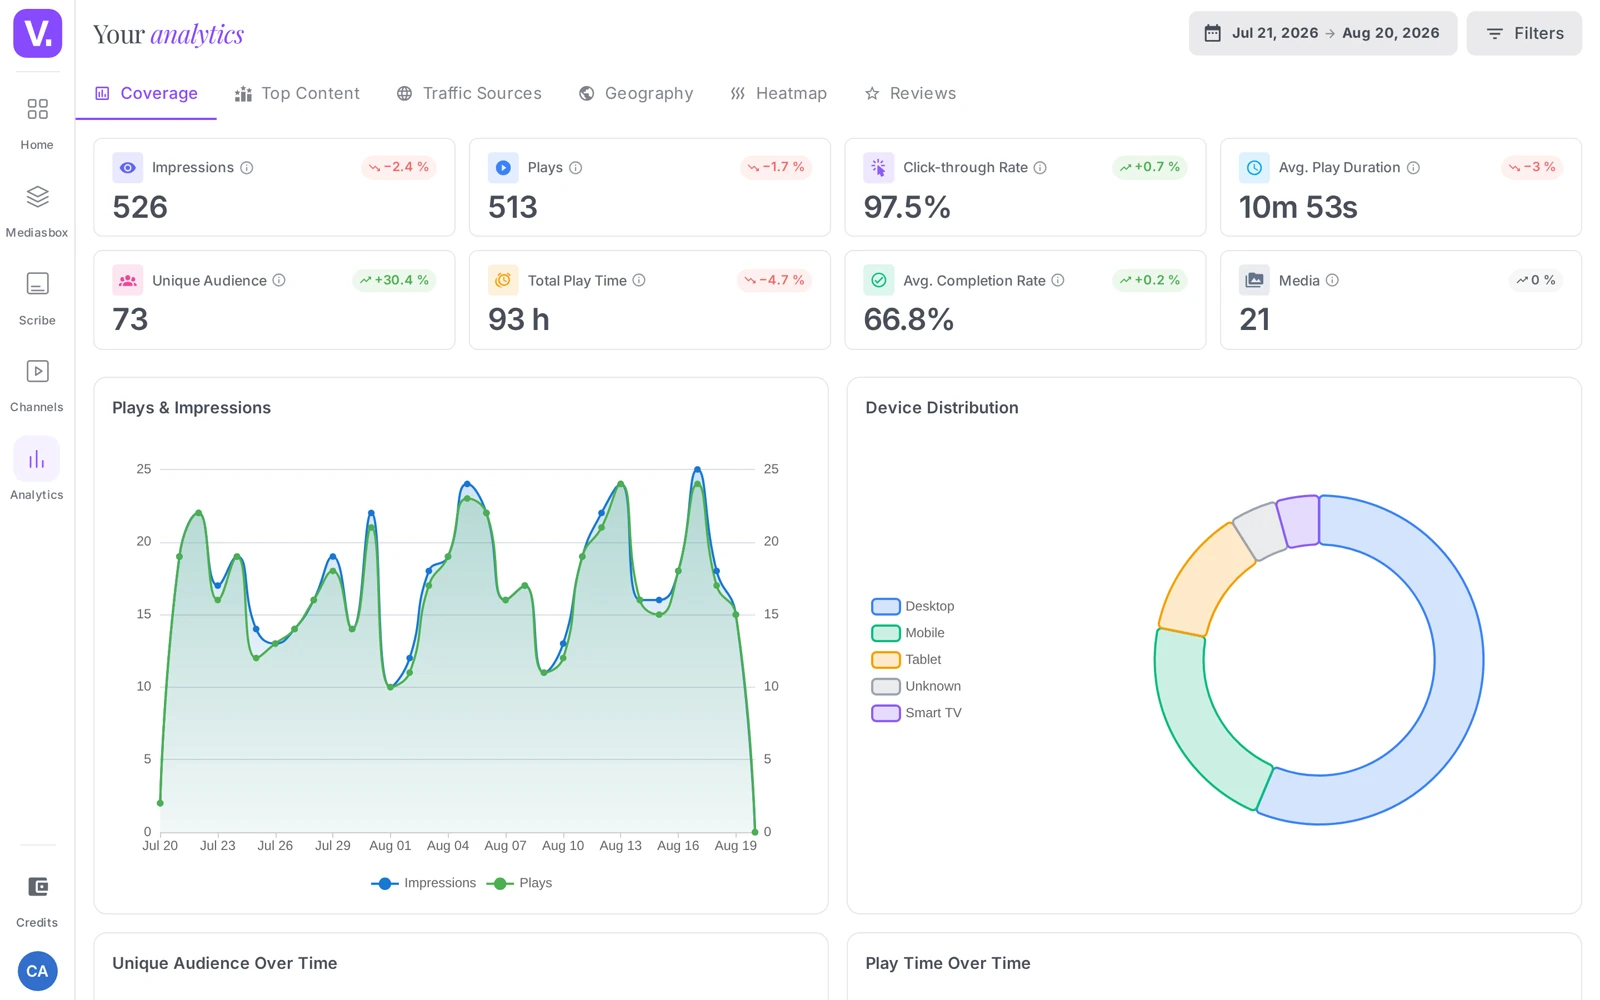
Note: an Impression is not a Play. A visitor who sees your thumbnail without clicking generates an impression; an engaged play is required to count as a Play. A workspace with no data yet shows a placeholder screen reading “Your analytics will appear here”.
Reading the metrics together
- High impressions + low click-through rate → your content is seen but rarely clicked: work on thumbnails and titles.
- High click-through rate + low completion rate → people click but drop off: sharpen the hook and the first few seconds.
- Unique audience ≪ Plays → the same audience keeps coming back (good loyalty).
The Top content tab
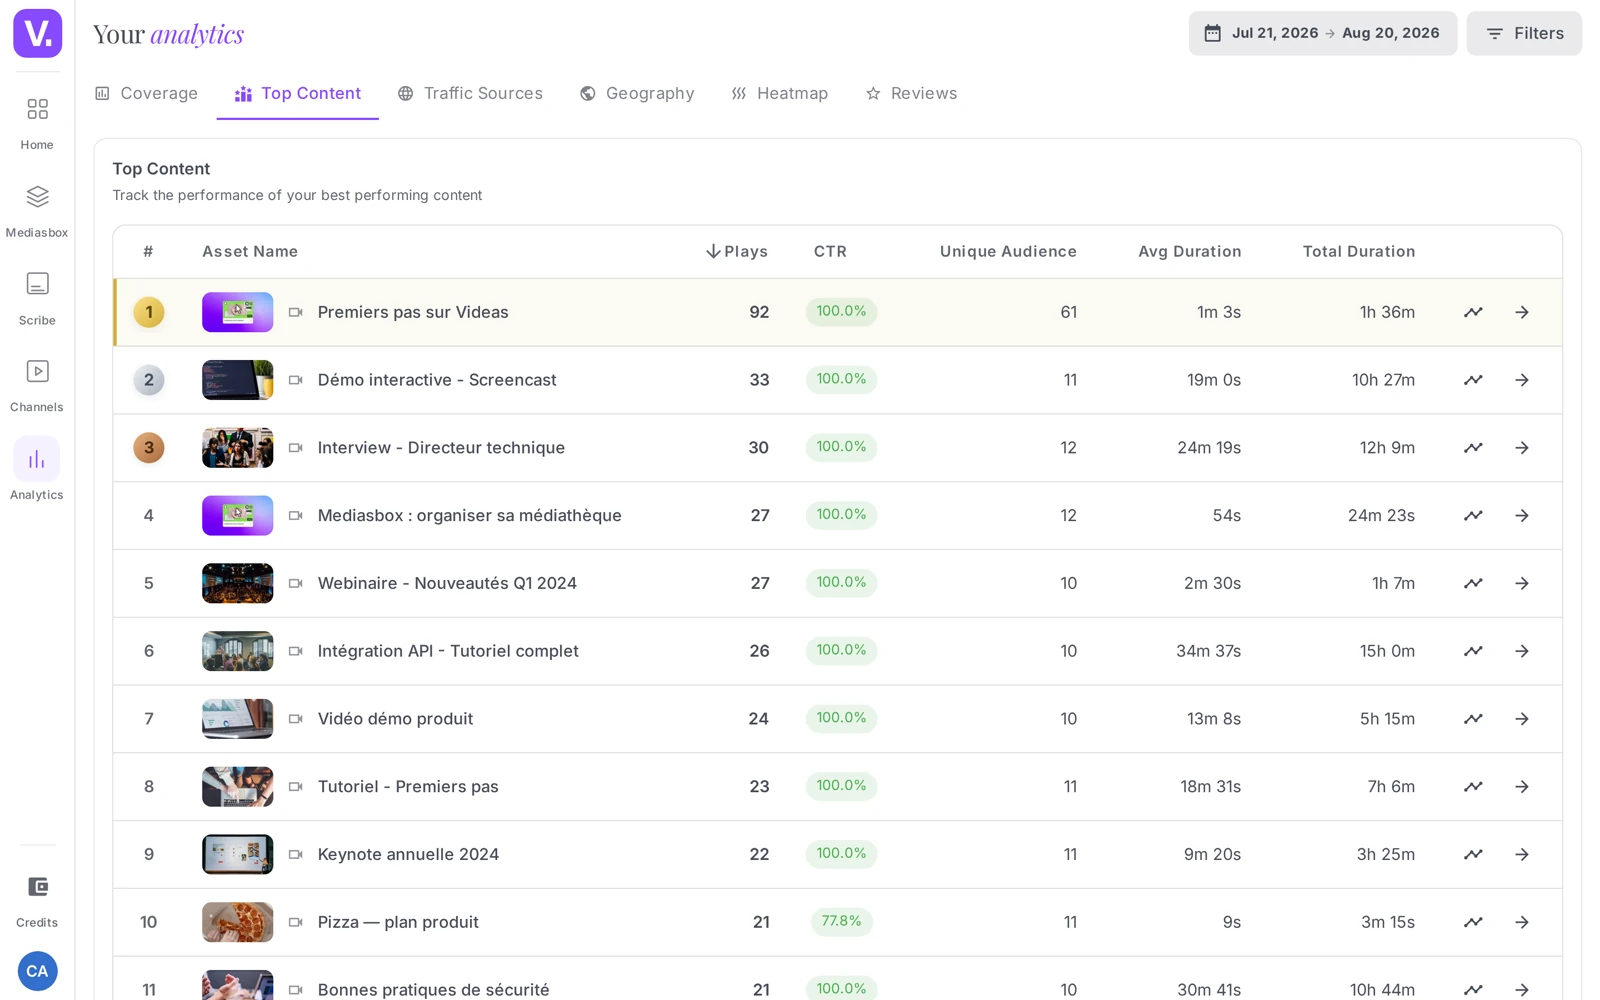
Top content ranks your media by performance over the period. For each item the table shows: Asset name, Plays, Impressions, CTR, Unique audience, Avg. duration, Total duration, Completion and Trend. You choose to display the Top 10, 20, 50, 100 or All, and you sort by any column.
This is the view for editorial trade-offs: spotting your most-played content, the pieces that hold attention best (high completion), and those that attract but disappoint (many plays, low completion).
The Reviews tab
Reviews gathers the ratings and comments left on your content. At the top, the summary metrics: Average rating, Total reviews, Rated assets, Reviews per asset and Satisfaction. Below, the rating distribution and the list of reviews (positive, neutral, negative).
It is the qualitative counterpart to the figures: content that is played a lot but rated poorly deserves a look, and conversely a quiet piece with excellent ratings can be promoted.
The other angles of analysis
The same app offers three more tabs, each covered in its own article:
- Geography — where your viewers come from (see Analyze the geographic breakdown of your viewers)
- Traffic sources — which sites your videos are watched on (see See which sites your videos are watched on)
- Heatmap — at which moments of a video the audience drops off (see Analyze a video’s engagement with the heatmap)
Exporting your analytics
An Export button lets you download the displayed data (CSV or spreadsheet) to cross-check it elsewhere or archive a report. The export covers the active view and period.
Analytics and privacy
Analytics are based on actual plays, aggregated by session, with no third-party tracking cookie (no advertising pixel). You track audience trends, not individuals — an approach suited to organizations that pay attention to GDPR.
Audience measurement as a whole: the Analytics product page sets out what Videas measures, and how it does so without third-party cookies.
Impression or play: what is the difference?
An impression counts a display — your thumbnail appears in a list, a suggestion, a page. A play counts an engaged play, past the first few seconds. A visitor who sees your thumbnail without clicking generates one impression and zero plays.
The gap between the two is the instructive part: their ratio, the click-through rate, measures how effective your thumbnails and titles are, independently of the quality of the content itself.
What should I do when the click-through rate is low?
Work on the thumbnail and the title — that is all the click-through rate measures. Many impressions and few clicks means your content is seen but does not invite opening.
The opposite diagnosis reads just as clearly: a high click-through rate with a low completion rate means the promise attracts but the content does not hold. There it is the hook and the first few seconds to rework, not the thumbnail.
What does a unique audience far below the play count mean?
That the same audience keeps coming back. Each distinct person counts once in the unique audience, however many times they return: a marked gap between the two figures is a loyalty signal, not a problem.
It is the cross-reading that makes these indicators useful. Taken alone, none of the eight says much; read in pairs, they point to the action to take.
Who can view the analytics?
Any member of the organization. A video’s analytics are visible to any member, and the global analytics in the Analytics menu require nothing more than membership — they are not reserved for administrators.
That is a deliberate choice: audience figures serve editorial decisions, and confining them to admins would deprive the people who make the content.
Does Videas set tracking cookies on my viewers?
No. Analytics rest on actual plays, aggregated by session, with no third-party cookie and no advertising pixel. You follow audience trends, not individuals.
That is what lets you use these figures without weighing down your consent banner, and what makes the approach workable for an organization mindful of GDPR.
Why are my analytics empty?
Because no play has yet been recorded within the scope displayed — Videas then shows a waiting screen reading “Your analytics will appear here”.
Before concluding, check two settings at the top of the screen: the period, set to the last 30 days by default, and the Filters panel, where one forgotten filter (content type, device, country, workspace) is enough to empty the table.
In short
- Analytics open from the Analytics menu (organization/workspace) or the Analytics tab of a video; any member of the organization can view them
- A period filter (8 presets + custom) and a Filters panel (type, devices, countries, workspaces) drive the whole screen
- Reach = 8 metrics (Impressions, Plays, Click-through rate, Avg. watch duration, Unique audience, Total watch time, Avg. completion rate, Media) + 4 charts
- Top content ranks your media; Reviews gathers ratings and comments
- Real, aggregated data, with no third-party cookie
Related articles
Screenshots were taken on Videas Academy, an example channel built for this help center. It belongs to a fictional customer, not to Videas: your own channel carries your name, your branding and your prices.